

Here are your print-outs, Frank.
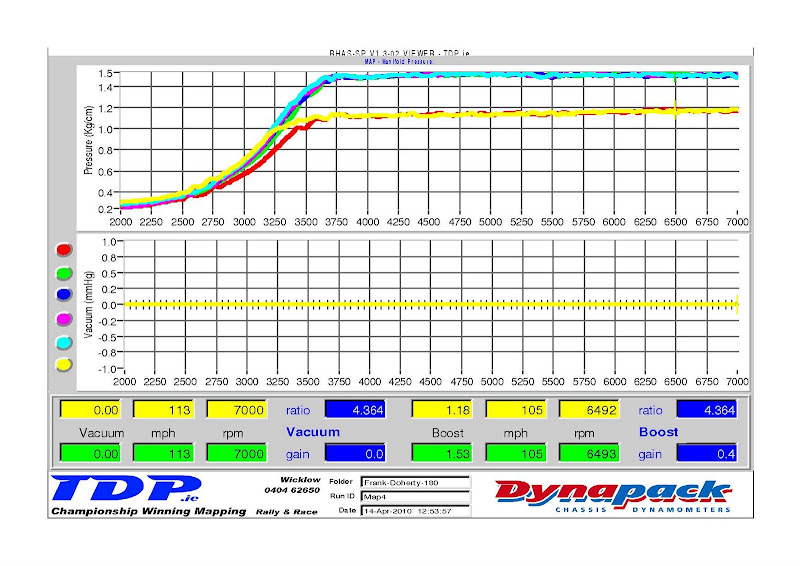
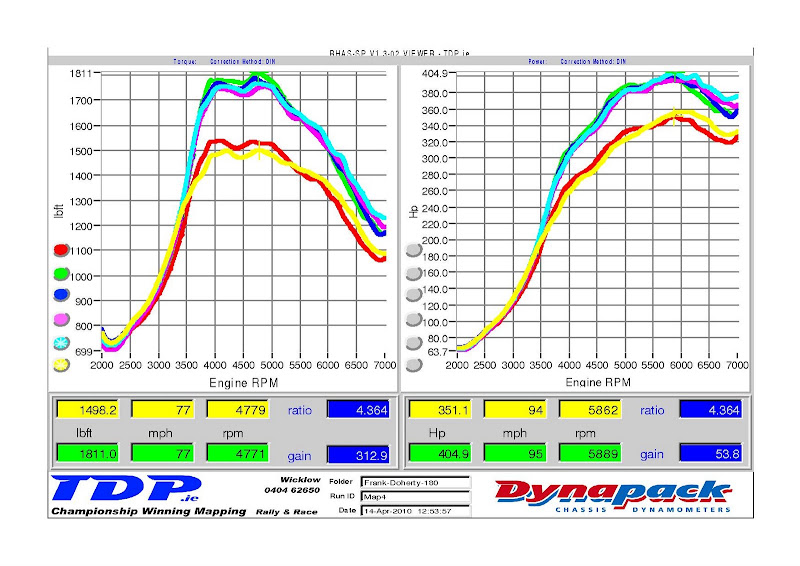
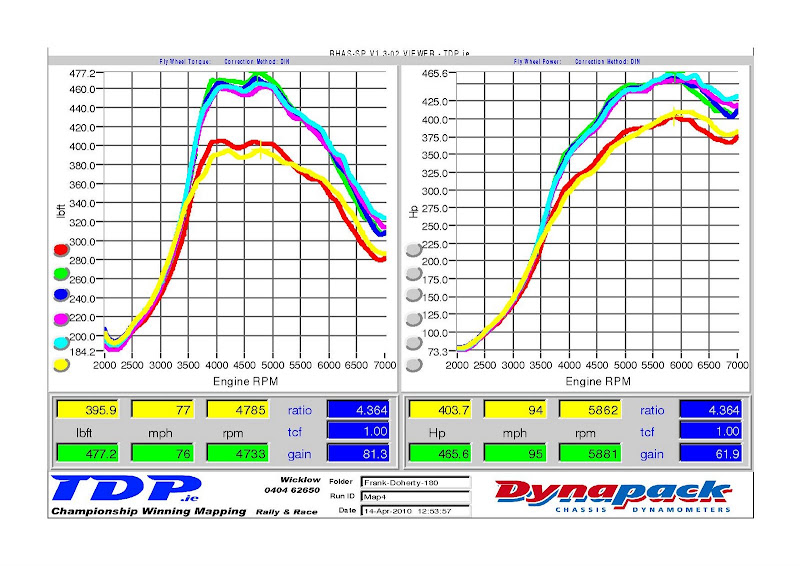
The red and yellow lines are at low boost. The other lines are at high boost.
The first image shows the torque (lbft) on the left hand side of the page, and power (BHP) on the right hand side of the page, measured at the hubs. The torque figure is the ‘true torque’. It is calculated by: the torque produced at the flywheel multiplied by the gear ratio and the final drive ratio. The power figure is the power produced at the axles.
The second image shows flywheel torque (lbft) on the left hand side of the page and flywheel power (BHP) on the right hand side. As the title suggests, this is the torque and power that is produced at the flywheel. These figures are estimated and are correct to ± 5%.
The last image shows boost pressure.
Follow Us On



Results 251 to 260 of 308
Thread: Bn sports 180sx - Rebuild!
-
15-04-10, 17:29 #251Member
- Status
- Offline
- User ID
- 708
- Join Date
- Dec 2009
- Posts
- 8

-
15-04-10, 21:25 #252di Member
- Status
- Offline
- User ID
- 8
- Join Date
- May 2009
- Posts
- 2,094
Slightly better attempt than me
 Cheers
Wes (RM PERFORMANCE) a buddy of mine from town gave me a hand towards the end, did a real nice job wiring it and stuff. thanks lad
Finally got the steering arms i needed today so fitted them and have most of the setup done must just finish it tomorrow.
Firewall is also made so we are almost ready to rock!
400 horses............. 1 jockey
-
15-04-10, 21:29 #253di Member
- Status
- Offline
- User ID
- 50
- Join Date
- May 2009
- Posts
- 719
looks sweet there lad
looking like your hot to trot now
-
15-04-10, 21:30 #254di Member
- Status
- Offline
- User ID
- 160
- Join Date
- May 2009
- Location
- Letterkenny , Co. Donegal
- Posts
- 2,692
Sweeeet figures man,well done

-
15-04-10, 21:35 #255di Member
- Status
- Offline
- User ID
- 253
- Join Date
- Jul 2009
- Location
- Cork
- Posts
- 1,138
Looking good frank.
Cant wait to see it in the daylight
Are you going to try running the sr box ?
-
15-04-10, 21:38 #256di Member
- Status
- Offline
- User ID
- 8
- Join Date
- May 2009
- Posts
- 2,094
Im not gonna try I AM gonna run the sr box.
I dont have any choice to be honest James
Its either have a go or leave the car at home
400 horses............. 1 jockey
-
15-04-10, 21:57 #257Pro Driver
- Status
- Offline
- User ID
- 171
- Join Date
- Jun 2009
- Posts
- 1,693
lad blow da balls outa da box!!! don't hold bak on it!! give er all shes got if she blows at least ya can say she was gettin serious doggin!!
-
15-04-10, 22:01 #258di Member
- Status
- Offline
- User ID
- 8
- Join Date
- May 2009
- Posts
- 2,094
Ha ha i love your attitude lad, we will see hows things go
knowing my luck something else will go wrong...
400 horses............. 1 jockey
-
15-04-10, 22:04 #259di Member
- Status
- Offline
- User ID
- 21
- Join Date
- May 2009
- Location
- cork
- Posts
- 637
nice to see it nearly racing now,best of luck!!
-
15-04-10, 22:06 #260Pro Driver
- Status
- Offline
- User ID
- 171
- Join Date
- Jun 2009
- Posts
- 1,693
im only runnin a stock box dis weekend and you wont see me sparin it!!!


 Reply With Quote

